TRANSMISSION AND DISTRIBUTION (FACTS & FIGURES)
| (i) Customer Response Time: A Key Aspect of Service Delivery |
|
Timely responses to customer requests are a cornerstone of our service delivery. To ensure consistent and efficient service, we have developed three Key Performance Indicators (KPIs) to closely monitor and track our performance in this area:
|
| (ii) Reliability of Supply |
Ensuring Reliability of Supply
We are dedicated to enhancing the reliability of power supply and minimising power interruptions. This commitment is supported by the continuous monitoring of SAIDI, SAIFI, and CAIDI indices, aligned with best international practices.
Presented below are the SAIDI*, SAIFI**, and CAIDI figures for the past five years (2020–2024), reflecting ongoing efforts to maintain and improve service reliability.
| Parameters | Units | Areas | 2020 | 2021 | 2022 | 2023 | 2024 |
|---|---|---|---|---|---|---|---|
| SAIDI * | Hours | North | 2.58 | 4.05 | 3.16 | 2.94 | 3.32 |
| Centre | 2.49 | 2.38 | 2.62 | 3.71 | 4.25 | ||
| South | 3.31 | 2.91 | 3.29 | 3.38 | 4.44 | ||
| SAIFI ** | Index | North | 1.33 | 1.71 | 1.29 | 1.19 | 1.03 |
| Centre | 1.48 | 1.62 | 1.62 | 2.06 | 2.35 | ||
| South | 2.36 | 2.35 | 2.56 | 1.63 | 2.03 |
*SAIDI: System Average Interruption Duration Index – the average duration of electricity interruptions experienced by a customer over a given period.
**SAIFI: System Average Interruption Frequency Index – the average number of interruptions a customer has experienced over a given period.
| Parameters | Units | Areas | 2020 | 2021 | 2022 | 2023 | 2024 |
|---|---|---|---|---|---|---|---|
| CAIDI = SAIDI/SAIFI *** | Hours | North | 1.94 | 2.37 | 2.45 | 2.46 | 3.22 |
| Centre | 1.68 | 1.47 | 1.62 | 1.80 | 1.81 | ||
| South | 1.41 | 1.24 | 1.29 | 2.07 | 2.19 |
System LossesSystem losses refer to the percentage of electricity generated that does not reach end-users due to technical and non-technical factors. Minimizing these losses is a critical part of ensuring efficient and sustainable energy delivery. Over the years, concerted efforts have been made to monitor and reduce system losses in line with international standards and best practices. Below is a summary of system losses over the past nine years:
|
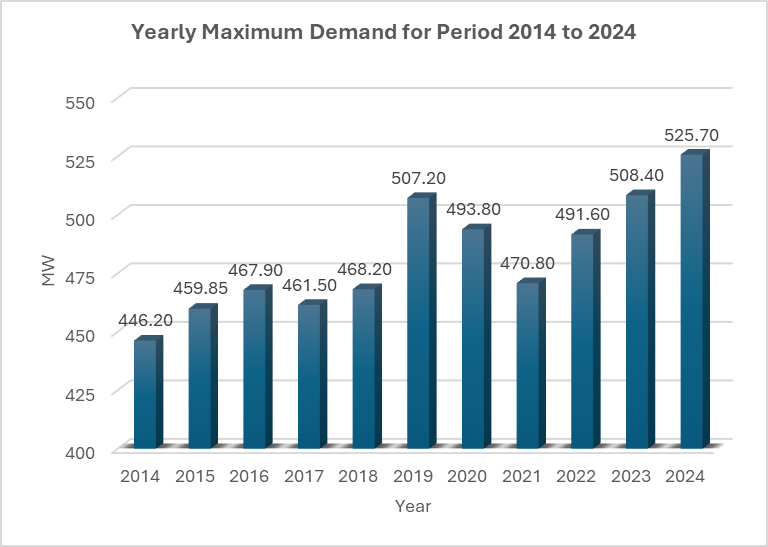
Peak Demand
On 22 January 2025, at 9:00 PM, an all-time peak electricity demand of 545.7 MW was recorded. This milestone underscores the rising demand for electricity, driven by economic growth, increased industrial activity, prevailing extreme weather conditions, and the expanding energy requirements of households and businesses.
The yearly maximum electricity demand for the period 2014 to 2024 is provided below, highlighting the growth in energy requirements over the years: